No one can forget the collapse of the housing market that precipitated the most catastrophic financial crisis in recent history. Ironically, the same industry is nursing local economies back to good health. Although mortgages continue to saddle American consumers, who collectively owed $8.17 trillion in housing debt by the end of the second quarter of 2015, signs of economic improvement abound, thanks to real estate’s resurrection.

As of the first quarter of 2015, for instance, about 255,000 consumers had a bankruptcy notation added to their credit reports, the lowest quarterly total since 2006. Foreclosure rates have also dipped to their lowest since that same year. In addition, lower down payments and higher approval rates for people with average credit scores indicate a growing housing market.
Given such promising evidence of steady economic recovery, WalletHub compared the real-estate markets in 25 of the largest metropolitan areas across 10 key metrics. Our data set ranges from the interest rate on a first mortgage to the percentage of households that have received state or local assistance on their first housing loan. Our findings, as well as expert commentary and a detailed methodology, can be found below.
Healthiest Housing Market
|
Overall Rank |
Metro Area |
|
Overall Rank |
Metro Area |
|---|---|---|---|---|
| 1 | Boston, MA | Info | T-13 | Washington, DC-MD-VA |
| 2 | Oklahoma City, OK | Info | T-13 | Chicago, IL |
| 3 | San Antonio, TX | Info | 16 | Detroit, MI |
| 4 | Northern New Jersey, NJ | Info | 17 | Miami-Hialeah, FL |
| 5 | Hartford, CT | Info | 18 | Richmond-Petersburg, VA |
| 6 | Austin, TX | Info | 19 | Seattle, WA |
| 7 | New York City, NY | Info | 20 | Jacksonville, FL |
| 8 | Rochester, NY | Info | 21 | Minneapolis-Saint Paul, MN |
| 9 | Philadelphia, PA-NJ | Info | 22 | Tucson, AZ |
| 10 | Houston, TX | Info | 23 | Orlando, FL |
| 11 | Louisville, KY | Info | 24 | Tampa-Saint Petersburg-Clearwater, FL |
| 12 | Nashville, TN | Info | 25 | Las Vegas, NV |
| T-13 | Baltimore, MD | Info | Info | Info |
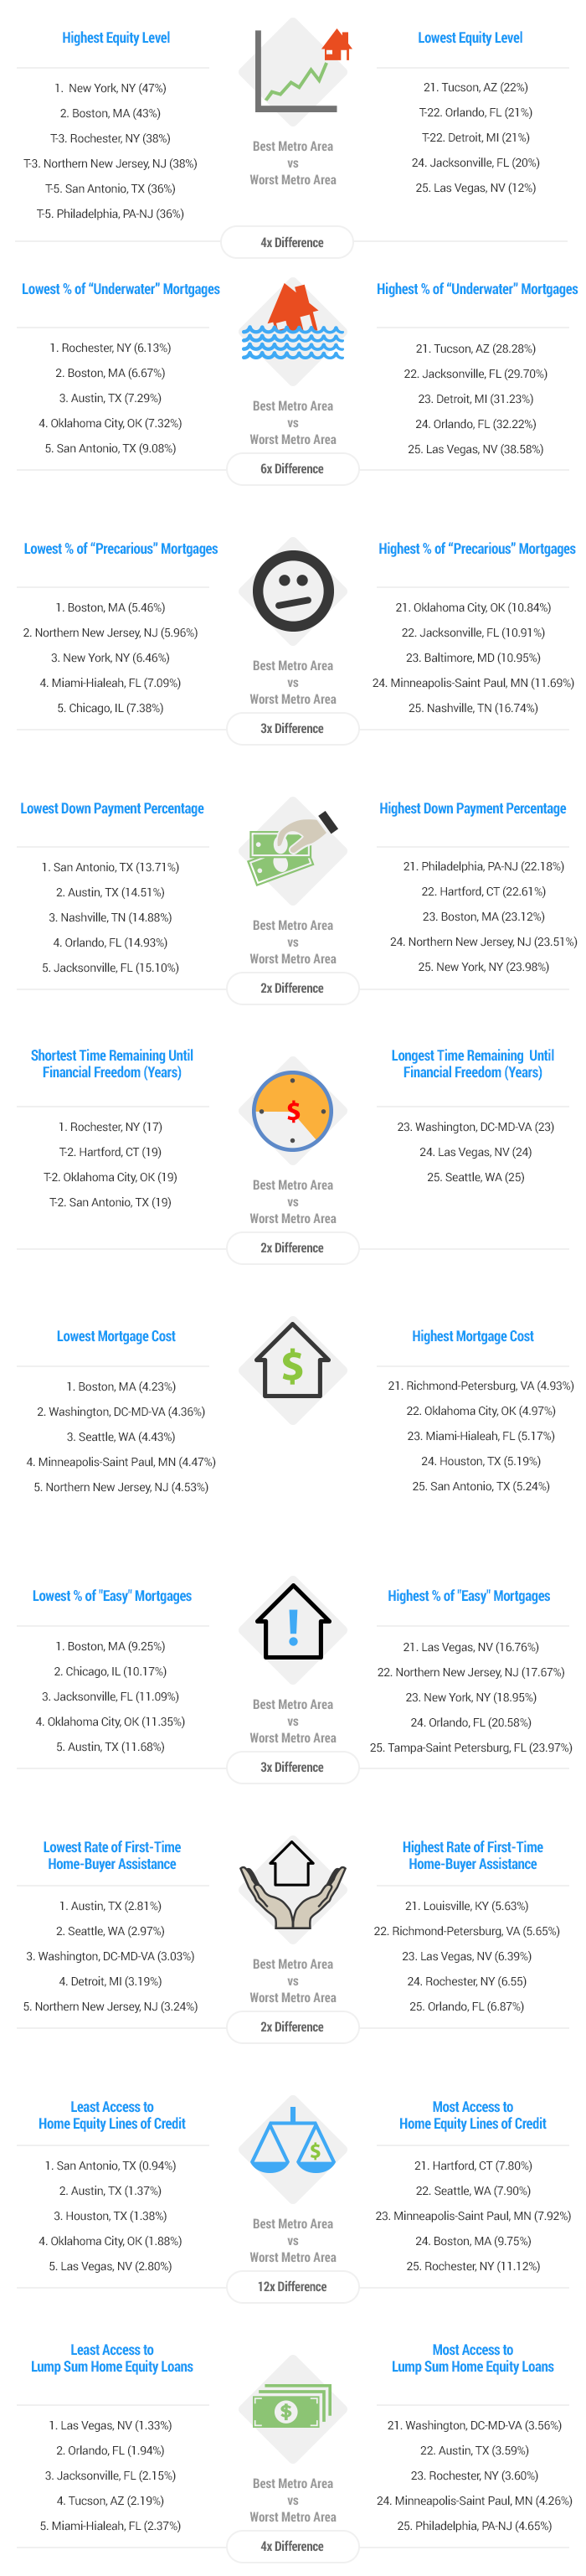
Equity Level
This metric measures the current equity as a percent of the home’s value.
|
Overall Rank |
Metro Area |
Home Equity/Home Value |
Overall Rank |
Metro Area |
Home Equity/Home Value |
|---|---|---|---|---|---|
| 1 | New York City, NY | 47.00% | 14 | Richmond-Petersburg, VA | 30.00% |
| 2 | Boston, MA | 43.00% | T-15 | Nashville, TN | 28.00% |
| T-3 | Rochester, NY | 38.00% | T-15 | Seattle, WA | 28.00% |
| T-3 | Northern New Jersey, NJ | 38.00% | T-15 | Chicago, IL | 28.00% |
| T-5 | San Antonio, TX | 36.00% | T-18 | Miami-Hialeah, FL | 27.00% |
| T-5 | Philadelphia, PA-NJ | 36.00% | T-18 | Minneapolis-Saint Paul, MN | 27.00% |
| 7 | Hartford, CT | 35.00% | 20 | Tampa-Saint Petersburg-Clearwater, FL | 25.00% |
| T-8 | Austin, TX | 33.00% | 21 | Tucson, AZ | 22.00% |
| T-8 | Baltimore, MD | 33.00% | T-22 | Orlando, FL | 21.00% |
| T-10 | Houston, TX | 32.00% | T-22 | Detroit, MI | 21.00% |
| T-10 | Oklahoma City, OK | 32.00% | 24 | Jacksonville, FL | 20.00% |
| T-10 | Washington, DC-MD-VA | 32.00% | 25 | Las Vegas, NV | 12.00% |
| T-10 | Louisville, KY | 32.00% | Info | Info | Info |
| Info | National Average | 30.00% | Info | Info | Info |
Equity Levels Over Time
“Underwater” Mortgages (Less than 0% Equity)
|
Rank |
Metro Area |
Mortgages “Underwater” |
Rank |
Metro Area |
Mortgages “Underwater” |
|---|---|---|---|---|---|
| 1 | Rochester, NY | 6.13% | 14 | Washington, DC-MD-VA | 14.59% |
| 2 | Boston, MA | 6.67% | 15 | Richmond-Petersburg, VA | 15.44% |
| 3 | Austin, TX | 7.29% | 16 | Minneapolis-Saint Paul, MN | 17.63% |
| 4 | Oklahoma City, OK | 7.32% | 17 | Seattle, WA | 18.91% |
| 5 | San Antonio, TX | 9.08% | 18 | Chicago, IL | 24.66% |
| 6 | Louisville, KY | 9.39% | 19 | Miami-Hialeah, FL | 25.94% |
| 7 | Nashville, TN | 9.57% | 20 | Tampa-Saint Petersburg-Clearwater, FL | 27.87% |
| 8 | New York City, NY | 9.96% | 21 | Tucson, AZ | 28.28% |
| 9 | Philadelphia, PA-NJ | 10.67% | 22 | Jacksonville, FL | 29.70% |
| 10 | Houston, TX | 10.70% | 23 | Detroit, MI | 31.23% |
| 11 | Baltimore, MD | 11.89% | 24 | Orlando, FL | 32.22% |
| 12 | Hartford, CT | 12.53% | 25 | Las Vegas, NV | 38.58% |
| 13 | Northern New Jersey, NJ | 13.80% | Info | Info | Info |
| Info | National Average | 15.12% | Info | Info | Info |
“Precarious” Mortgages (Between 0%-10% Equity)
|
Rank |
Metro Area |
“Precarious” Mortgages |
Rank |
Metro Area |
“Precarious” Mortgages |
|---|---|---|---|---|---|
| 1 | Boston, MA | 5.46% | 14 | Seattle, WA | 9.69% |
| 2 | Northern New Jersey, NJ | 5.96% | 15 | Houston, TX | 9.97% |
| 3 | New York City, NY | 6.46% | 16 | Tucson, AZ | 10.10% |
| 4 | Miami-Hialeah, FL | 7.09% | 17 | San Antonio, TX | 10.15% |
| 5 | Chicago, IL | 7.38% | 18 | Richmond-Petersburg, VA | 10.17% |
| 6 | Detroit, MI | 7.49% | 19 | Louisville, KY | 10.50% |
| 7 | Hartford, CT | 7.77% | 20 | Austin, TX | 10.55% |
| 8 | Orlando, FL | 8.17% | 21 | Oklahoma City, OK | 10.84% |
| 9 | Rochester, NY | 8.20% | 22 | Jacksonville, FL | 10.91% |
| 10 | Tampa-Saint Petersburg-Clearwater, FL | 8.61% | 23 | Baltimore, MD | 10.95% |
| 11 | Washington, DC-MD-VA | 9.03% | 24 | Minneapolis-Saint Paul, MN | 11.69% |
| 12 | Philadelphia, PA-NJ | 9.14% | 25 | Nashville, TN | 16.74% |
| 13 | Las Vegas, NV | 9.61% | Info | Info | Info |
| Info | National Average | 9.97% | Info | Info | Info |
Down Payment Percentage
This metric measures the amount of down payment put forward by households at the time of mortgage closing.
|
Rank |
Metro Area |
0-10 percent |
11-20 percent |
More than 20 percent |
Bought outright |
|---|---|---|---|---|---|
| 1 | San Antonio, TX | 62.40% | 15.12% | 13.87% | 8.61% |
| 2 | Austin, TX | 54.26% | 21.56% | 14.28% | 9.91% |
| 3 | Nashville, TN | 58.60% | 17.26% | 15.60% | 8.54% |
| 4 | Orlando, FL | 50.25% | 19.74% | 15.75% | 14.26% |
| 5 | Jacksonville, FL | 55.73% | 19.42% | 15.67% | 9.17% |
| 6 | Oklahoma City, OK | 56.96% | 16.70% | 16.41% | 9.94% |
| 7 | Houston, TX | 57.14% | 19.72% | 15.92% | 7.22% |
| 8 | Las Vegas, NV | 48.76% | 21.20% | 17.14% | 12.90% |
| 9 | Richmond-Petersburg, VA | 52.85% | 23.18% | 17.55% | 6.42% |
| 10 | Tucson, AZ | 50.56% | 18.90% | 19.67% | 10.88% |
| 11 | Miami-Hialeah, FL | 42.08% | 24.94% | 18.87% | 14.11% |
| 12 | Tampa-Saint Petersburg-Clearwater, FL | 44.01% | 20.26% | 20.19% | 15.55% |
| 13 | Louisville, KY | 51.83% | 19.56% | 20.21% | 8.39% |
| 14 | Baltimore, MD | 50.27% | 24.01% | 20.29% | 5.43% |
| 15 | Detroit, MI | 40.65% | 25.00% | 21.85% | 12.50% |
| 16 | Minneapolis-Saint Paul, MN | 49.76% | 23.17% | 22.07% | 4.99% |
| 17 | Washington, DC-MD-VA | 46.59% | 26.84% | 21.58% | 4.99% |
| 18 | Rochester, NY | 43.81% | 25.06% | 22.42% | 8.72% |
| 19 | Seattle, WA | 43.75% | 27.90% | 22.38% | 5.96% |
| 20 | Chicago, IL | 38.89% | 25.93% | 25.93% | 9.26% |
| 21 | Philadelphia, PA-NJ | 39.04% | 27.83% | 26.75% | 6.37% |
| 22 | Hartford, CT | 37.49% | 28.78% | 27.36% | 6.36% |
| 23 | Boston, MA | 34.79% | 30.57% | 28.00% | 6.64% |
| 24 | Northern New Jersey, NJ | 32.80% | 28.75% | 29.26% | 9.19% |
| 25 | New York City, NY | 34.15% | 26.02% | 30.62% | 9.21% |
| Info | National Average | 49.79% | 22.16% | 19.35% | 8.70% |
Remaining Time Until Financial Freedom
This metric measures the medium number of years left until the mortgage is paid.
|
Rank |
Metro Area |
Years Needed to Pay off 1st Mortgage |
Rank |
Metro Area |
Years Needed to Pay off 1st Mortgage |
|---|---|---|---|---|---|
| 1 | Rochester, NY | 17 | T-12 | Minneapolis-Saint Paul, MN | 21 |
| T-2 | Hartford, CT | 19 | T-12 | Nashville, TN | 21 |
| T-2 | Oklahoma City, OK | 19 | T-12 | Richmond-Petersburg, VA | 21 |
| T-2 | San Antonio, TX | 19 | T-12 | Chicago, IL | 21 |
| T-5 | Houston, TX | 20 | T-18 | Austin, TX | 22 |
| T-5 | Miami-Hialeah, FL | 20 | T-18 | Baltimore, MD | 22 |
| T-5 | Louisville, KY | 20 | T-18 | Orlando, FL | 22 |
| T-5 | Detroit, MI | 20 | T-18 | Tampa-Saint Petersburg-Clearwater, FL | 22 |
| T-5 | New York City, NY | 20 | T-18 | Tucson, AZ | 22 |
| T-5 | Northern New Jersey, NJ | 20 | 23 | Washington, DC-MD-VA | 23 |
| T-5 | Philadelphia, PA-NJ | 20 | 24 | Las Vegas, NV | 24 |
| T-12 | Boston, MA | 21 | 25 | Seattle, WA | 25 |
| T-12 | Jacksonville, FL | 21 | Info | Info | Info |
| Info | National Average | 21 | Info | Info | Info |
Mortgage Costs
This metric measures the interest rate on a first mortgage.
|
Rank |
Metro Area |
Interest Rate of 1st Mortgage |
Rank |
Metro Area |
Interest Rate of 1st Mortgage |
|---|---|---|---|---|---|
| 1 | Boston, MA | 4.23% | 14 | Detroit, MI | 4.78% |
| 2 | Washington, DC-MD-VA | 4.36% | 15 | New York City, NY | 4.79% |
| 3 | Seattle, WA | 4.43% | 16 | Tampa-Saint Petersburg-Clearwater, FL | 4.80% |
| 4 | Minneapolis-Saint Paul, MN | 4.47% | 17 | Jacksonville, FL | 4.81% |
| 5 | Northern New Jersey, NJ | 4.53% | 18 | Austin, TX | 4.81% |
| 6 | Las Vegas, NV | 4.54% | 19 | Tucson, AZ | 4.83% |
| 7 | Hartford, CT | 4.57% | 20 | Rochester, NY | 4.89% |
| 8 | Baltimore, MD | 4.63% | 21 | Richmond-Petersburg, VA | 4.93% |
| 9 | Philadelphia, PA-NJ | 4.64% | 22 | Oklahoma City, OK | 4.97% |
| 10 | Chicago, IL | 4.66% | 23 | Miami-Hialeah, FL | 5.17% |
| 11 | Nashville, TN | 4.69% | 24 | Houston, TX | 5.19% |
| 12 | Orlando, FL | 4.78% | 25 | San Antonio, TX | 5.24% |
| 13 | Louisville, KY | 4.78% | Info | Info | Info |
| Info | National Average | 4.71% | Info | Info | Info |
Easy Mortgages
This measures the percentage of total mortgages obtained with no proof of income, assets or debt.
|
Rank |
Metro Area |
1st Mortgage Obtained Without Proof |
Rank |
Metro Area |
1st Mortgage Obtained Without Proof |
|---|---|---|---|---|---|
| 1 | Boston, MA | 9.25% | 14 | Detroit, MI | 14.47% |
| 2 | Chicago, IL | 10.17% | 15 | Minneapolis-Saint Paul, MN | 14.53% |
| 3 | Jacksonville, FL | 11.09% | 16 | Miami-Hialeah, FL | 15.12% |
| 4 | Oklahoma City, OK | 11.35% | 17 | Tucson, AZ | 15.30% |
| 5 | Austin, TX | 11.68% | 18 | San Antonio, TX | 15.76% |
| 6 | Baltimore, MD | 12.34% | 19 | Philadelphia, PA-NJ | 16.19% |
| 7 | Seattle, WA | 12.57% | 20 | Houston, TX | 16.22% |
| 8 | Washington, DC-MD-VA | 12.65% | 21 | Las Vegas, NV | 16.76% |
| 9 | Richmond-Petersburg, VA | 13.03% | 22 | Northern New Jersey, NJ | 17.67% |
| 10 | Hartford, CT | 13.09% | 23 | New York City, NY | 18.95% |
| 11 | Louisville, KY | 13.70% | 24 | Orlando, FL | 20.58% |
| 12 | Rochester, NY | 13.73% | 25 | Tampa-Saint Petersburg-Clearwater, FL | 23.97% |
| 13 | Nashville, TN | 13.76% | Info | Info | Info |
| Info | National Average | 17.02% | Info | Info | Info |
First-Time Home-Buyer Assistance
This metric measures the percentage of households that received help through state or local government programs on their first mortgage.
|
Rank |
Metro Area |
1st Mortgage Obtained with Assistance |
Rank |
Metro Area |
1st Mortgage Obtained with Assistance |
|---|---|---|---|---|---|
| 1 | Austin, TX | 2.81% | 14 | Nashville, TN | 4.47% |
| 2 | Seattle, WA | 2.97% | 15 | Hartford, CT | 4.65% |
| 3 | Washington, DC-MD-VA | 3.03% | 16 | Chicago, IL | 4.73% |
| 4 | Detroit, MI | 3.19% | 17 | Tampa-Saint Petersburg-Clearwater, FL | 4.77% |
| 5 | Northern New Jersey, NJ | 3.24% | 18 | Jacksonville, FL | 4.92% |
| 6 | Tucson, AZ | 3.39% | 19 | Miami-Hialeah, FL | 5.33% |
| 7 | Minneapolis-Saint Paul, MN | 3.62% | 20 | New York City, NY | 5.33% |
| 8 | Baltimore, MD | 3.81% | 21 | Louisville, KY | 5.63% |
| 9 | Oklahoma City, OK | 3.83% | 22 | Richmond-Petersburg, VA | 5.65% |
| 10 | Philadelphia, PA-NJ | 4.06% | 23 | Las Vegas, NV | 6.39% |
| 11 | San Antonio, TX | 4.11% | 24 | Rochester, NY | 6.55% |
| 12 | Houston, TX | 4.14% | 25 | Orlando, FL | 6.87% |
| 13 | Boston, MA | 4.17% | Info | Info | Info |
| Info | National Average | 4.45% | Info | Info | Info |
Access to Financing
This metric measures the percentage of households with access to a home equity line of credit and/or a lump-sum home equity loan.
|
Metro Area |
Have a Home Equity Line of Credit |
Have a Lump-Sum Home Equity Loan |
|---|---|---|
| San Antonio, TX | 0.94% (1) | 3.55% (19) |
| Austin, TX | 1.37% (2) | 3.59% (22) |
| Houston, TX | 1.38% (3) | 2.63% (9) |
| Oklahoma City, OK | 1.88% (4) | 2.38% (6) |
| Las Vegas, NV | 2.80% (5) | 1.33% (1) |
| Jacksonville, FL | 2.91% (6) | 2.15% (3) |
| Orlando, FL | 4.34% (7) | 1.94% (2) |
| New York City, NY | 4.49% (8) | 2.51% (8) |
| Nashville, TN | 4.93% (9) | 2.47% (7) |
| Tucson, AZ | 5.34% (10) | 2.19% (4) |
| Detroit, MI | 5.77% (11) | 3.52% (18) |
| Tampa-Saint Petersburg-Clearwater, FL | 6.09% (12) | 3.32% (15) |
| Richmond-Petersburg, VA | 6.55% (13) | 3.04% (12) |
| Miami-Hialeah, FL | 6.80% (14) | 2.37% (5) |
| Washington, DC-MD-VA | 7.14% (15) | 3.56% (21) |
| Philadelphia, PA-NJ | 7.16% (16) | 4.65% (25) |
| Louisville, KY | 7.44% (17) | 3.56% (20) |
| Chicago, IL | 7.48% (18) | 2.86% (10) |
| Northern New Jersey Areas | 7.50% (19) | 3.02% (11) |
| Baltimore, MD | 7.71% (20) | 3.17% (14) |
| Hartford, CT | 7.80% (21) | 3.51% (17) |
| Seattle, WA | 7.90% (22) | 3.39% (16) |
| Minneapolis-Saint Paul, MN | 7.92% (23) | 4.26% (24) |
| Boston, MA | 9.75% (24) | 3.08% (13) |
| Rochester, NY | 11.12% (25) | 3.60% (23) |
| National Average | 5.16% | 2.68% |
Ask the Experts
The purchase of a new home is one of the largest financial transactions most Americans make during their lifetime. And for that reason, the decision should be treated with careful consideration and thorough planning. For additional insight into home-ownership, we asked a panel of real-estate experts to weigh in on the subject and offer their advice. Click on the experts’ profiles below to read their bios and responses to the following key questions:
- What tips do you have for consumers looking to secure a mortgage?
- What is the biggest mistake people make when buying a home?
- How much should consumers put down when purchasing a home?
- What role should government play in promoting home ownership?
- Are mortgage lending regulations too strict, too loose or just right?
Ask the Experts

Senior Lecturer of Economics at Ohio State University
Read More

Professor of Finance at University of Central Florida
Read More

Professor of Finance and Business Management at The Brooklyn College School of Business
Read More

Chair and Professor of Finance at University of Akron
Read More

Associate Professor of Commerce and Finance at University of Virginia, McIntire School of Commerce
Read More

Dean's Chair in Real Estate Professor in The Wharton School at University of Pennsylvania
Read More
Methodology
In order to identify the healthiest housing markets in the U.S., WalletHub compared 25 of the largest metropolitan areas (as defined in the AHS survey) across 10 key metrics, which are listed below with their corresponding weights. The metrics are based on questions from the American Housing Survey. We took into account only valid responses to the questions, excluding “no response” and “do not know” answers.
Equity Level: 2
“Underwater” Mortgages (Less than 0% Equity): 1
“Precarious” Mortgages (Between 0%-10% Equity): 1
Down Payment Percentage: 1
- Down Payment: 0–10%
- Down Payment: 11–20%
- Down Payment: More than 20%
- Bought Outright
Note: In order to rank the metro areas by this indicator, we used a weighted average between the middle of each range and the percentage in that rung (for properties “bought outright,” we used zero as the middle of the interval). The lower the value obtained, the higher the metro area was ranked in the case of this metric.
Remaining Time Until Financial Freedom (measures the average number of years needed to pay off a mortgage): 2
Mortgage Costs (interest rate on first mortgage): 1
“Easy” Mortgages (measures the percentage of total mortgages obtained with no proof of income, assets or debt): 1
First-Time Home-Buyer Assistance (measures the percentage of households assisted by state or local government programs on their first mortgage): 1
Access to Financing - Percentage of Consumers with a Home Equity Line of Credit: 0.5
Access to Financing - Percentage of Consumers with a Lump-Sum Home Equity Loan: 0.5
Source: Data used to create these rankings were obtained from the U.S. Census Bureau and the U.S. Department of Housing and Urban Development.
WalletHub experts are widely quoted. Contact our media team to schedule an interview.